

SAP Meat and Fish Management by msg
Meat Control Tower
Meat Control Tower: Transparency and Control Across Meat Production
12.09.2022
As of early 2021, SAP Meat and Fish Management by msg features standardized operational reporting templates for different areas of the value chain. These templates can be copied and adapted to individual requirements, which allows the customer to keep an eye on important KPIs, identify deviations at an early stage and derive appropriate measures from them.
This article focuses on the specific reports for our protein customers: in our next issue (12/22) we will deal with the Core Control Tower, which is relevant for all food customers.
Slaughtering
Livestock Reception
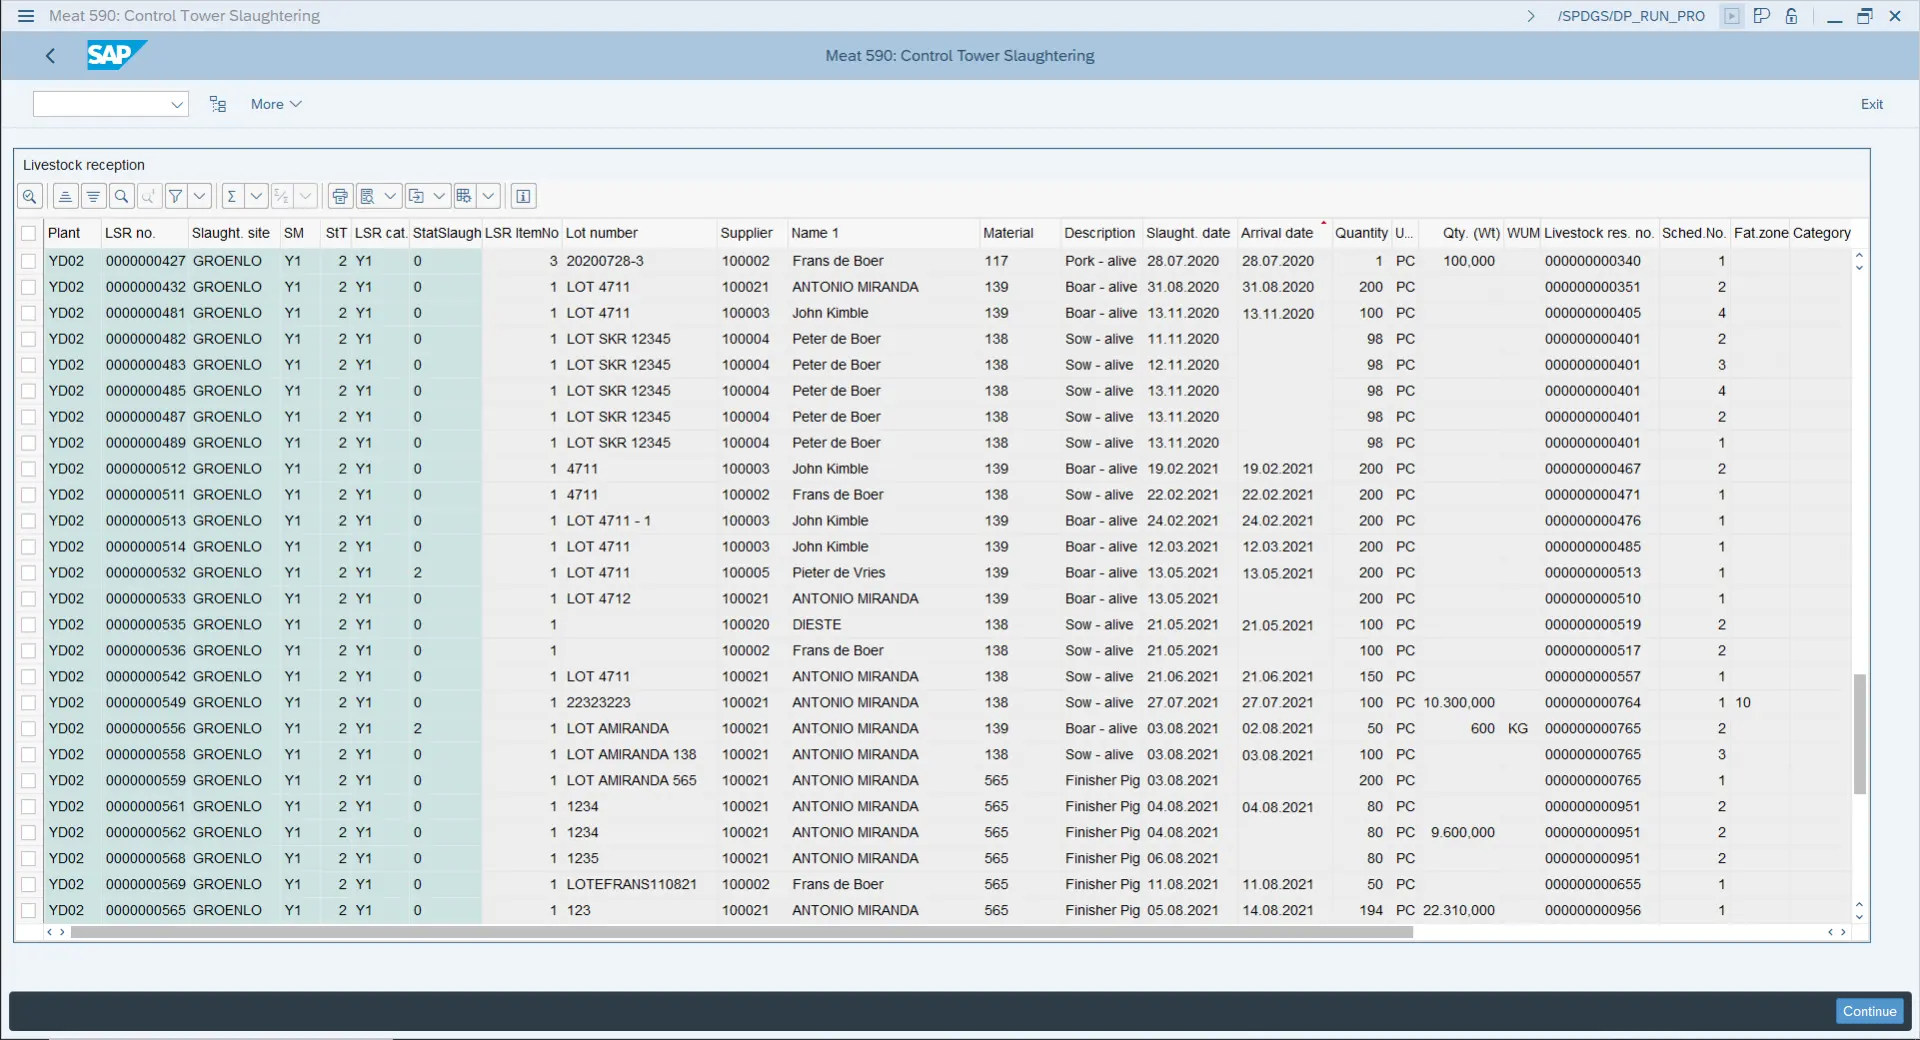
This evaluation gives an overview of all livestock receptions and the most important key figures: material, slaughtering date, arrival date, quantity, slaughtering method, etc.
Planned/Actual
How many animals have been received and how many slaughtered?
Time in Barn
How much time did the animals spend in the barn?
Current Barn Occupancy
This evaluation determines the occupancy with respect to the capacities of the individual units in the barn (pens).
Slaughtering Performance
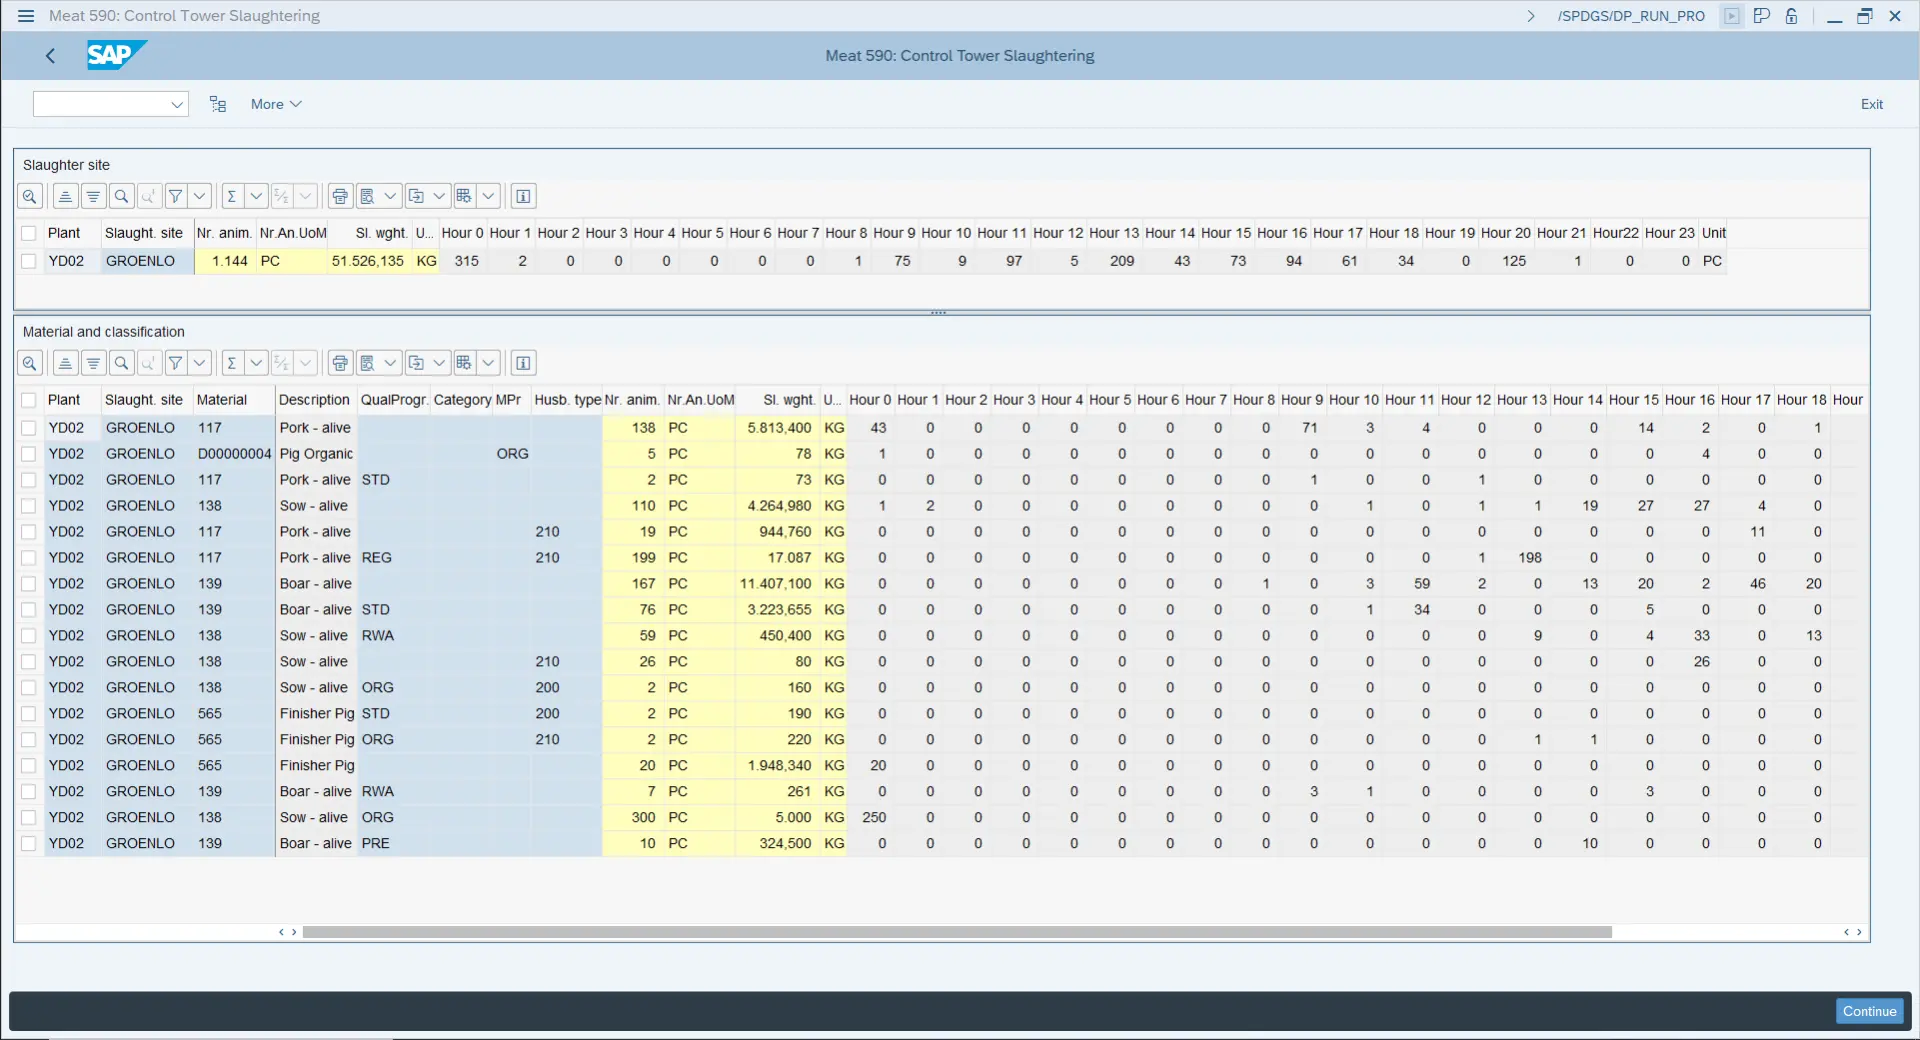
This evaluation shows the slaughtering performance, i.e. the number of animals slaughtered per hour.
Disassembly Process
Order Controlling
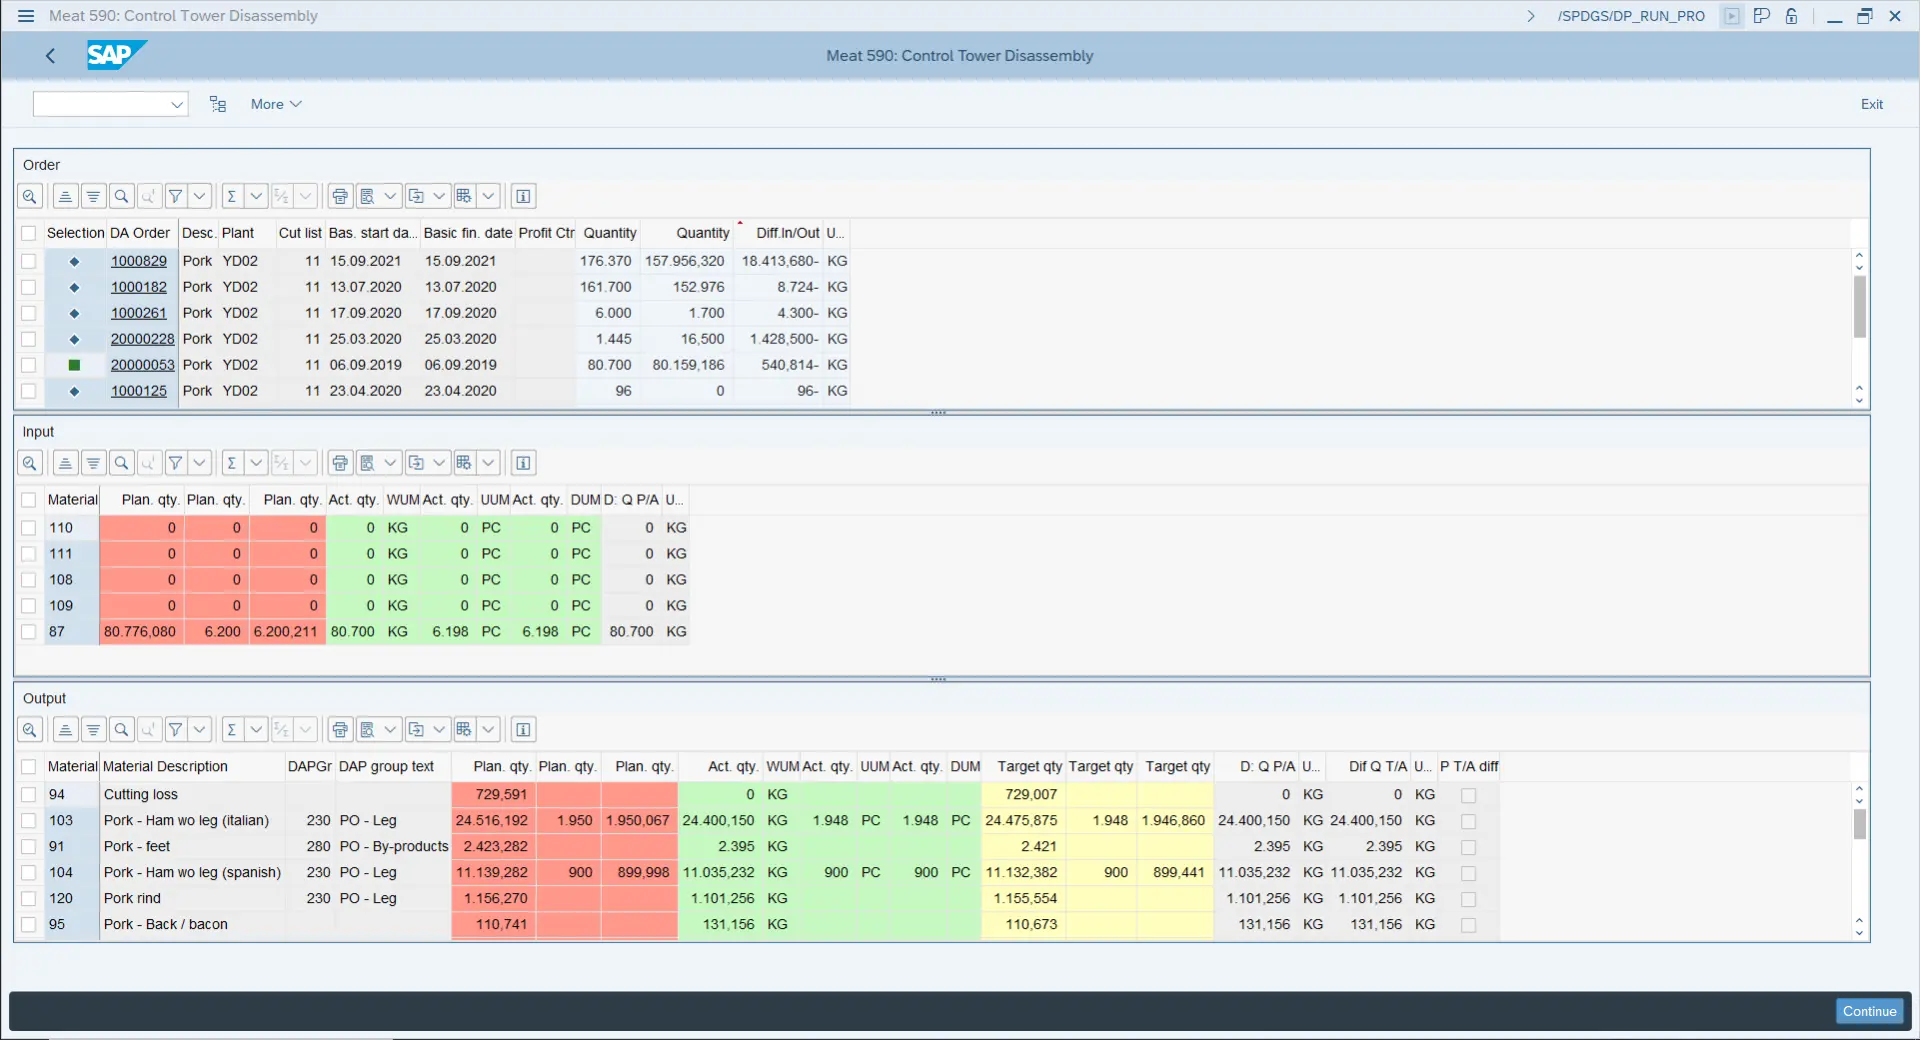
The evaluation makes it possible to evaluate all disassembly processes over a certain period of time. In the Order view, the input and output quantities are compared; in the two additional views, the details of the corresponding order can be evaluated and deviations identified. Using a hotspot, the user can branch into the job at any time and analyze further details.
Yield Control for Balance
In this evaluation, the yield per material (planned/target/actual) is determined. This can also be done without order or cut list reference.
Change ID Control
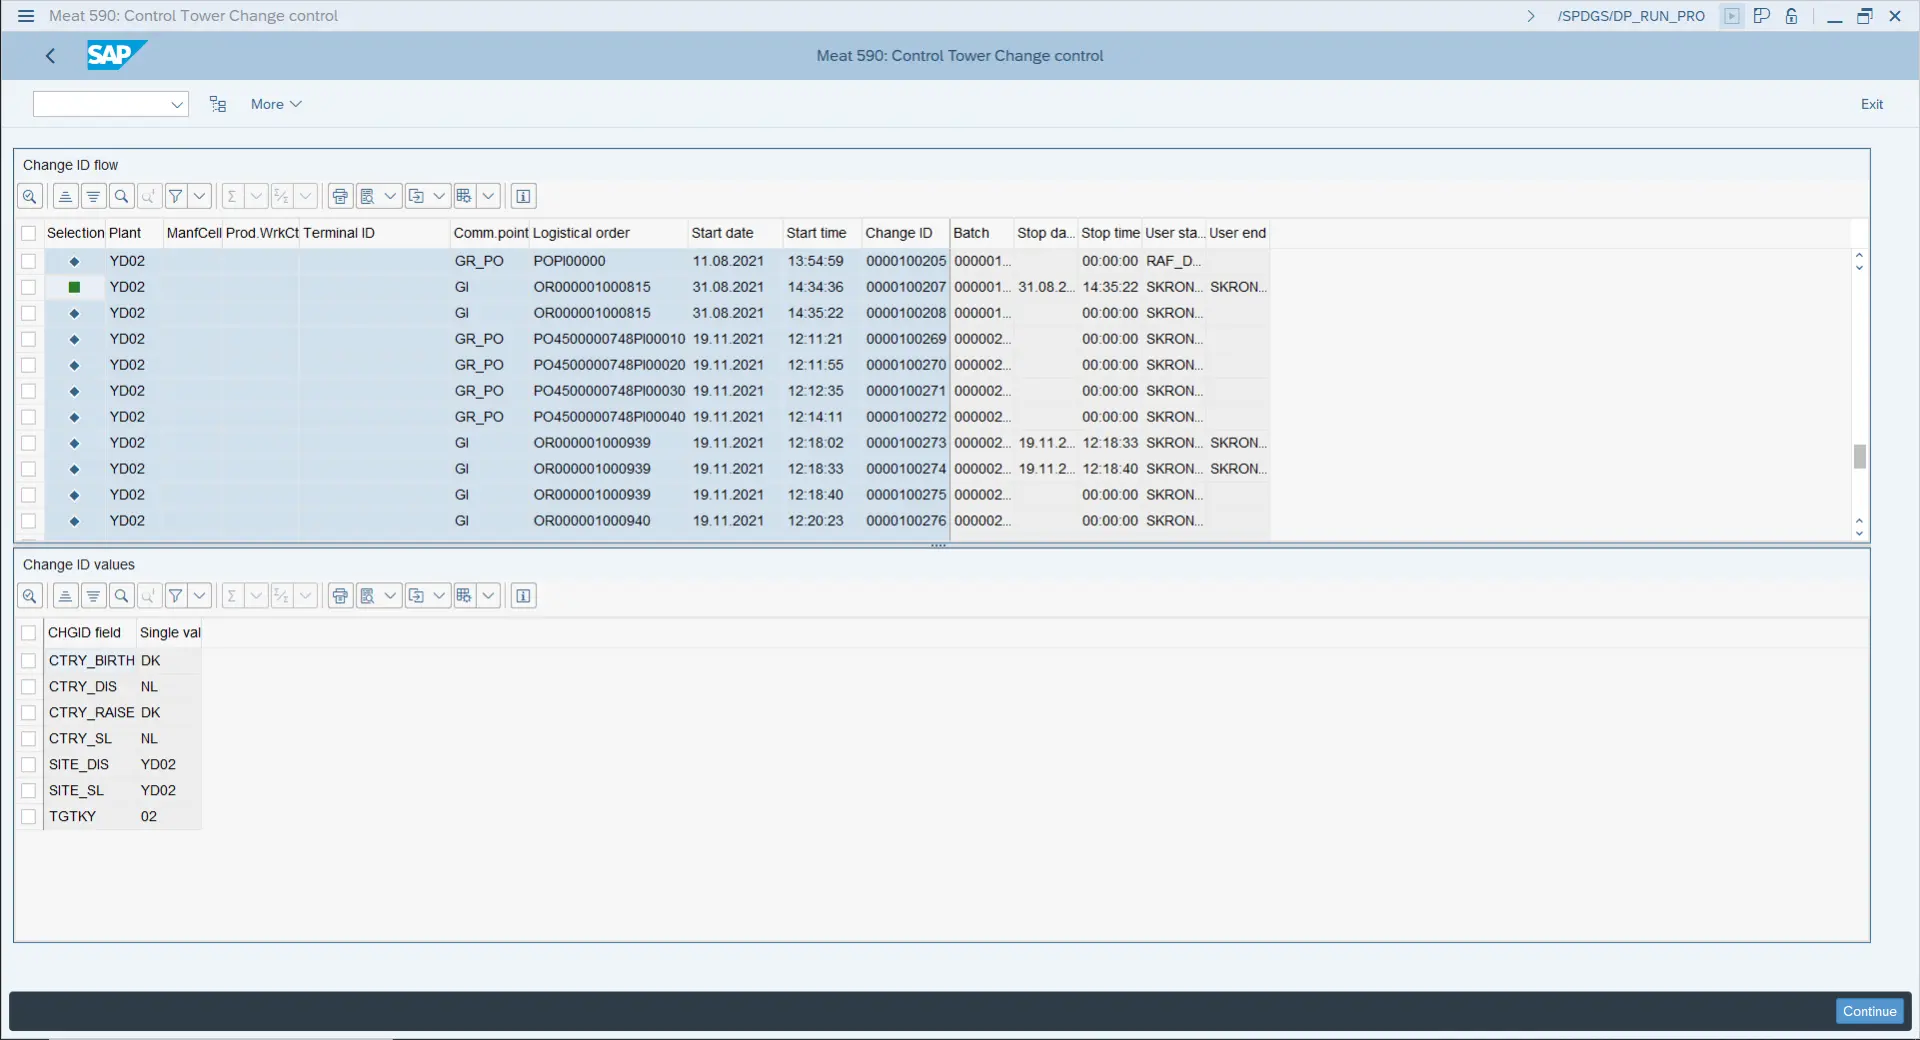
A report for the evaluation of the change flow was created within the context of Change ID Control, i.e. all change IDs for an object (purchase order, order, etc.) and additional information such as the batch for the change ID are displayed. In the second screen area, the corresponding values for the change ID can be displayed.
Cycle-Based Production
Facilities Overview
All cycles (running, completed, planned) for a facility can be displayed. With the help of this report, you can see which of the facilities are not yet occupied.
Cycle Analysis
The cycle analysis compares the planned, target and actual quantities of the individual activities (aggregated).
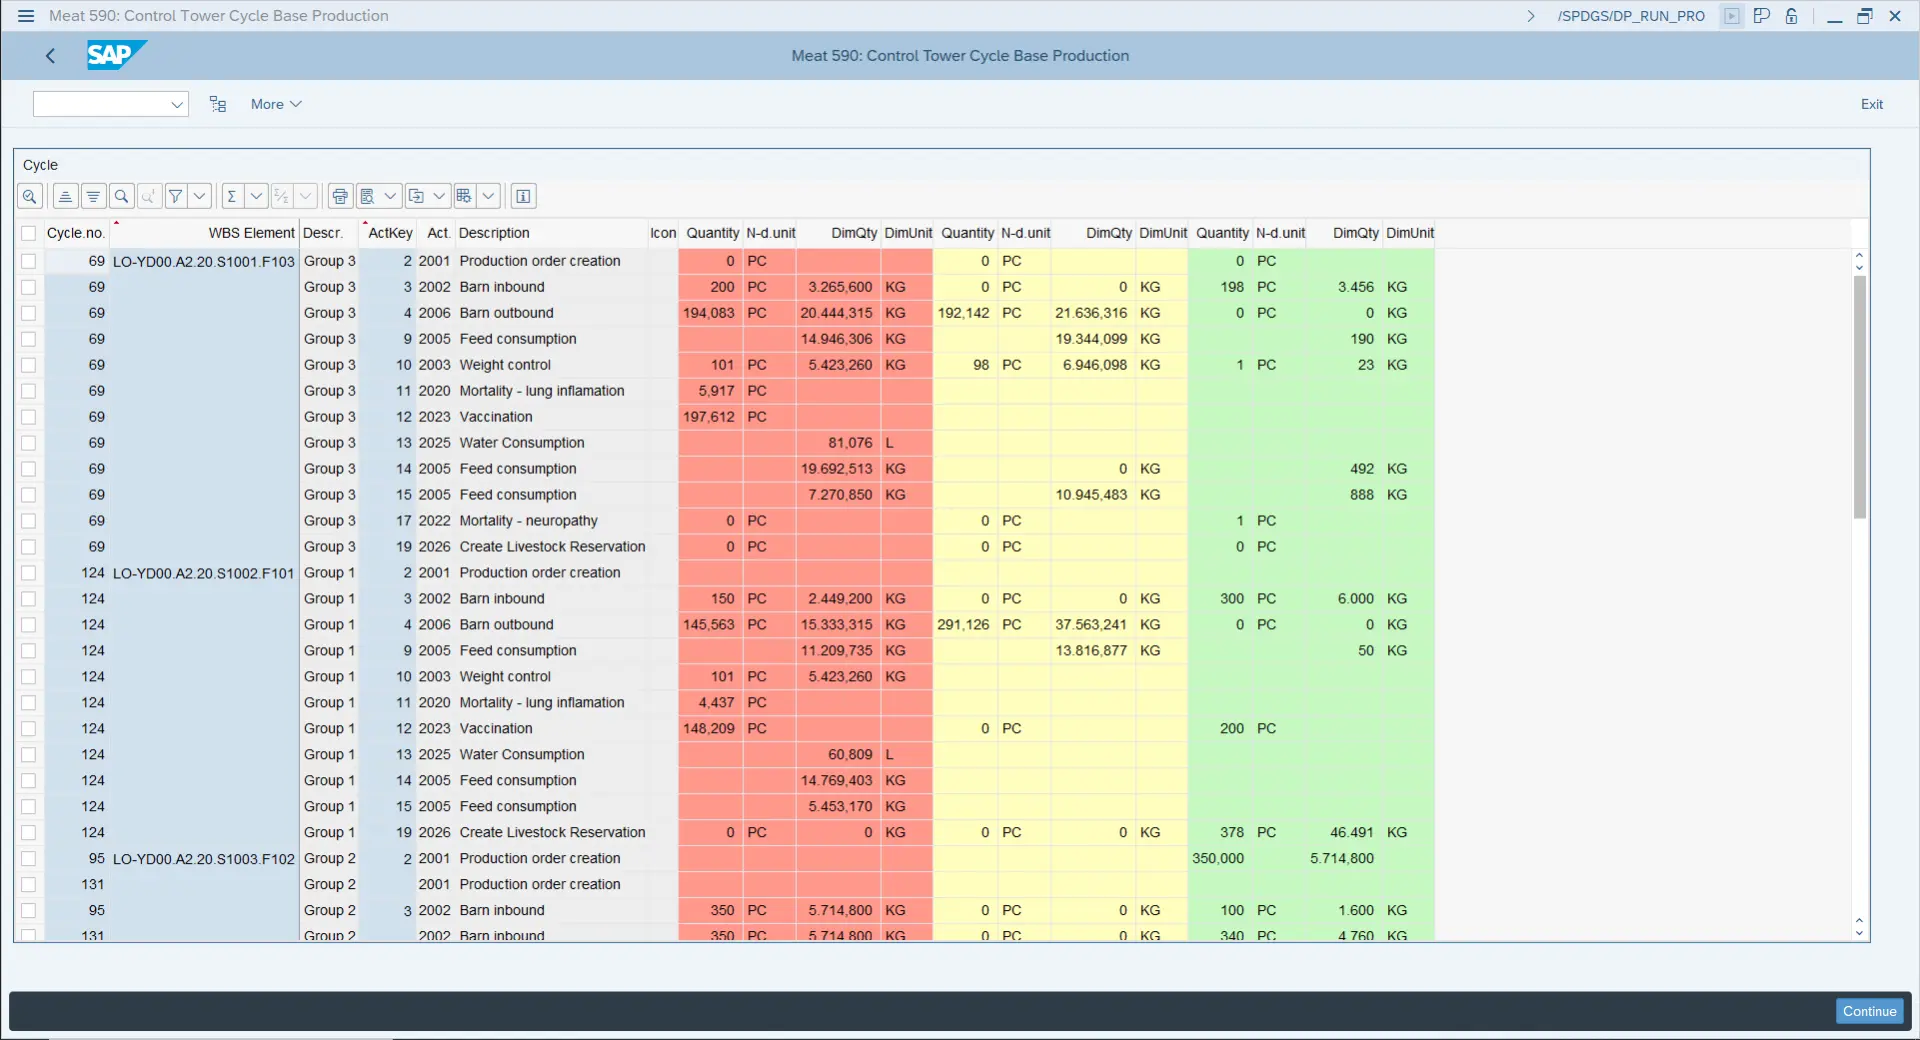
The cycle progress is similar to the cycle analysis. However, the activities are not aggregated but compared according to the stored expectations per day, week, month or even year. This makes it possible, for example, to evaluate the daily planned, target and actual feed consumption.
Consumption Rate
The consumption rate can be used to determine the feed conversion ratio (FCR). The FCR is the mass of the input divided by the output (this can be protein or, for example, milk).